This version of the Canadian Accessibility and Remoteness Index (CARI+) measures access to public high schools in Canada via travel time and distance.
Access to education is recognized as a fundamental social determinant of health. It’s been shown that the trip from home and school is the most common travel activity amongst Children in Canada. Education plays a crucial role in predicting social, economic and even health outcomes in youth across Canada. Schools in local communities allow for higher educational attainment, leading to post-secondary education, community socioeconomic development and the overall reduction of inequities. However, students in rural areas of Canada face local and systemic barriers to access secondary school, such as long travel distances, limited transportation options and limited local school options. In recent years, policies across Canada have caused the closure of local schools in smaller, more rural communities and the amalgamation of small schools into larger schools.
ArcGIS StoryMap:
Atherton C, McGaughey T, Yasin A, & PA Peters. [Spatial Determinants of Health Lab] (2025, Nov 11). Rural Access to High Schools in Canada [ArcGIS StoryMap].
https://storymaps.arcgis.com/stories/9adf570f87ef47c79ca89e559a7c06a0.
Calculation of the CARI+
This CARI+ index measure was calculated using the general methodology for CARI+, as described in Canadian Geographies / Géographies canadiennes. This methodology was adapted to calculate accessibility to secondary schools in Canada. It was achieved by measuring from population-weighted Dissemination Area (DA) centroids to secondary schools as service centre locations.
Lists of secondary schools were obtained from provincial ministry of education websites and locations were validated using a custom ArcGIS Survey123 tool.
Inclusion criteria consisted of public English and French high schools offering Grades 11 and 12. The list was further refined by excluding schools that provided private services, served specialized populations (e.g., students with developmental delays), lacked a reported facility type, or operated as independent schools. Schools offering online only programming or adult continuing education were also excluded.
Interpretation
The continuous index can be used within statistical modelling as a measure of access, while the classified scores can be mapped to show areas with higher or lower access. The latter can also be included in statistical modelling as a categorical or ordinal measure. The purpose of the analysis is to understand the measure of accessibility for secondary schools depending on a population’s geographic location, as indicated by travel time and distance. This can be interpreted as a relative measure of spatial access between small geographic areas (DAs) to school locations.
Travel distance, time, methods, and conditions impact access to education (secondary education in the context of this analysis), a fundamental social determinant of health, which in turn affects social, economic, and health outcomes in youth across Canada. Access to high school education is essential on a community and personal level. It contributes to community socioeconomic development, economic competitiveness, sociocultural growth, and overall reduction of inequities. It is also associated with choosing to pursue post secondary education which also contributes to the aforementioned benefits.
Difficulty in accessing secondary education decreases the likelihood of successfully completing it, resulting in more difficulty in breaking cycles of disadvantage (social reproduction) (Long et al., 2021; Verhoeven et al., 2019). Additionally, it is associated with decreased health literacy and knowledge of health promoting behaviours, impacting one’s lifespan and quality thereof (Howley et al., 2001). Secondary education, and other levels in general, play a role in identity development in personal and social environments, and are essential in establishing healthy relationships (Long et al., 2021; Verhoeven et al., 2019).
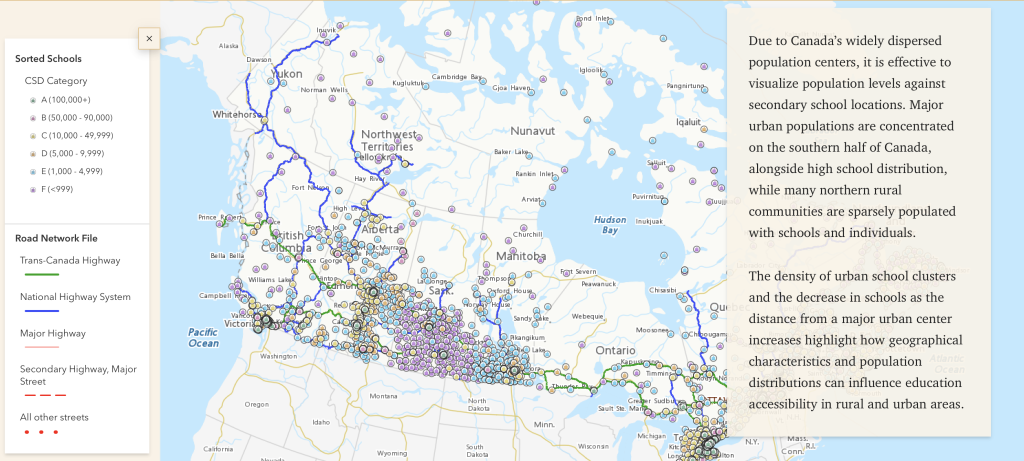
Although Canada’s population is increasing, most growth occurs in Census Metropolitan Areas (CMAs) and Census Agglomerations (CAs). Many rural communities experience reduced access to public services in contrast to the ongoing focus on urban areas, as seen in continued rural school closures (Haynes, 2022). These trends reinforce existing rural disadvantages, where geographic isolation and lower population density limit access to education and other services.
This imbalance is demonstrated by population and school distribution. High school distribution is denser among major urban populations while rural communities have fewer options and longer distances to travel. Increased school density allows for school selection most suited to youth and encourages other, active, modes of transport such as walking and cycling. On the other hand, rural communities, even those with significant youth populations, are restricted by a smaller selection of schools locally or rely on distant urban centers while facing longer travel times, and additional challenges due to road conditions and limited transportation despite acceleration in road construction in recent years, creating barriers to access and impacting students’ well-being.
The CARI+ score and/or classification can be used as a covariate alongside other individual and area-based measures such as demographics (e.g., race, gender, age) and socioeconomic factors (e.g., income, education) in a study on access to secondary schools in rural Canada. Specifically, in rural contexts, the data can be used to assess the relationship between school accessibility and the degree of marginalization, where present. A key example is Indigenous communities, particularly those on reserves, which often face limited access to public services and poor infrastructure.
The analysis can inform policy decisions on building new schools, enhancing access to high schools, and reducing geographic barriers that limit educational opportunities for rural youth. The CARI+ score proves evidence that rural communities face significant challenges in accessing education, pushing policymakers and government officials to allocate resources more effectively, prioritize underserved areas, and design targeted interventions to ensure equitable access.
Definitions and Limitations
High School / Secondary Education: the terms apply to educational institutions that follow elementary schooling, and are often used interchangeably (Fine-Meyer, 2013). They typically prepare students for opportunities after graduation, including but not limited to post-secondary education, training, or employment (Fine-Meyer, 2013). The specific definition varies by Province.
Selected References
- Fine-Meyer, R. (2013, December 16). High School (Secondary School). The Canadian Encyclopedia. https://www.thecanadianencyclopedia.ca/en/article/high-school-secondary-school.
- Howley, C., Howley, A., & Shamblen, S. (2001). Riding the school bus: a comparison of the rural and suburban experience in five states. Journal of Research in Rural Education, 17(1), 41–63. https://journals.newprairiepress.org/jrre/article/id/20468/.
- Haynes, M. (2022). The impacts of school closure on rural communities in Canada: A review. The Rural Educator, 43(2), 60–74. https://doi.org/10.55533/2643-9662.1321.
- Long, E., Zucca, C., & Sweeting, H. (2021). School Climate, Peer Relationships, and Adolescent Mental Health: A Social Ecological Perspective. Youth & Society, 53(8), 1400–1415. https://doi.org/10.1177/0044118X20970232.
- McGaughey T, Peters PA. Introducing the Canadian Accessibility and Remoteness Index (CARI+). Can Geogr Le Géographe Can 2026;70. https://doi.org/10.1111/cag.70082.
- Verhoeven, M., Poorthuis, A. M. G., & Volman, M. (2019). The Role of School in Adolescents’ Identity Development. A Literature Review. Educational Psychology Review, 31(1), 35–63. https://doi.org/10.1007/s10648-018-9457-3.